20 Posts from September 2011
- Sep 28, 2011 Posted By: Livio Di Matteo Tags: accountability, democracy, development, policy institute, thunder bay, transparency, waterfront
Thunder Bay's political scene is fascinating because it is often punctuated by issues that generate substantial controversy or excitement and then they proceed to fade away into obscurity and silence. Three recent ones come to mind:
1. When will construction start on the waterfront hotel and condos? While the waterfront has been a flurry of construction activity, all has been silent on exactly what new hotel is going to anchor the development and indeed when construction will start. I do recall a deputation to council some time ago by the developers asking for the height of the project to be increased but since then, there has been silence...Will there soon be a beacon of light?
2. What ever happened to the proposed hotel and mega Tim Horton's development slated for the treed area at the corner of John and Junot? There was a rather heated public meeting with neighborhood residents on the issue and the issue was supposed to be discussed at June's council meeting but since then nothing has been heard. The Mayor came out and stated he did not want to see the development go through in a residential neighborhood. Has the project been dropped or will the issue be quietly slipped into a meeting at a time of the year when people are preoccupied with other issues - say December with Christmas - and then quietly passed so construction can start in the spring? Will we hear an outcome soon or can we expect continued silence...
3. The provincial government's Northern Growth Plan promised a "Policy Institute" to deal with Northern Ontario policy research and allow northerners to help craft their own regional policies. In March, provincial dollars ( 5 million from the Heritage Fund) to fund the institute were announced and the presidents of Laurentian and Lakehead tasked to guide implementation. It apparently was even mentioned at the Think North II Summit. So what happened? Nothing has been announced yet. More ominously, Minister Gravelle's four page Summer 2011 Newsletter does not even mention the northern Policy Institute once. All is quiet. All is calm. We are in the midst of the election and it has not even been re-promised. There is silence...
Democracy is supposed to be a process whereby otherwise ordinary people can participate in the decision making and governance of their society. Part of the process requires transparency with public issues, particularly when public money is involved. Given all the public money being spent on the waterfront development and the centrality of private sector investment to the development plan, when will we see construction of the condos and hotel begin? This is an important issue given that we are about to embark on another massive public sector project - the multiplex - that will also require public investment. Given the neighborhood impact of the proposed development on Junot and John and the neighborhood concern, when exactly will Council discuss it and a decision be rendered? Given the promises made by the provincial government towards a Northern Ontario Public Policy institute, why has it disappeared from local discussion? What has happened to the five million dollars earmarked for it? Does anyone know? Does anyone even care?
- Sep 28, 2011 Posted By: Livio Di Matteo Tags: election, minority government, ontario, twitter
Who won last night's Ontario leader's debate? From the bit of the debate I saw, there were no clear winners and losers and all three leaders managed to hold their own reasonably well. However, for an incumbent, holding your own may not be enough and an examination of the number of Twitter followers suggests that Dalton McGuinty may be the debate loser. McGuinty's share of Twitter followers has declined slightly during the month of September from 45 percent on September 7th to 44 percent on September 26th while the shares of Mike Schreiner and Tim Hudak remained the same at 6 percent and 30 percent respectively. Andrea Horwath increased her share slightly over this period from 19 to 20 percent. The debate was held yesterday and as of today, McGuinty is now down to 43 percent while Horwath is up to 21 percent while Schreiner and Hudak are still at 6 percent and 30 percent respectively. In one day, there was a greater shift than occurred during the first couple weeks of the campaign. This could signal that many voters perceive Horwath the most favorably in the wake of the debate.

The earth may have finally begun to move. It would appear that based on the number of Twitter followers, Horwath is up, McGuinty is down and Hudak is holding his own. Polls have indicated a close race with a potential minority government situation after October 6th. Should this type of preference shift continue over the days leading to October 6th we could very well be on the road to a Conservative minority government as the NDP erode the Liberal vote.
P.S. By the way, did anyone notice if any part of the debate dealt explicitly with Northern Ontario economic issues? If it did, I seem to have missed it.
- Sep 27, 2011 Posted By: Livio Di Matteo Tags: economy, employment, growth, northwest ontario, ontario
I've taken the monthly employment numbers for all of Ontario and for Northwestern Ontario for the period 1990 to 2011 from Statistics Canada. These are three month moving averages unadjusted for seasonality but I then use them to construct annualized growth rates for each month. For those of you who are interested, the two Statistics Canada series are: v2054703 and v2054737. The results are quite interesting. When you simply plot the growth rates for both Ontario and the Northwest against time (Figure 1), you get a picture of wider swings in employment growth in the Northwest versus Ontario as a whole. As well, you can see that while there were some periods when employment growth was negative or positive for both, there are times when they move in opposite directions. For example, the recession of the early 1990s see both the Northwest and Ontario with negative employment growth. However, the period from 1996 to 1998 sees the Northwest with negative employment growth while Ontario is generally positive. Ontario and the northwest are both positive again from about 1998 to 2000 but then Ontario continues to see positive employment growth rates while the Northwest is negative again. As we move forward, the recession period in 2009 sees both the Northwest and Ontario with negative employment growth rates but the recovery since 2010 after a brief spurt in the northwest sees a return to negative growth in our region while Ontario is in positive territory.
Figure 1

It would appear that when there is a recession, both Ontario as a whole and the Northwest experience negative growth rates. Outside of recession, Ontario as a whole sees positive employment growth rates while the Northwest seems to cycle between booms and busts. With such fluctuations, it is difficult to see what the trend might be in employment growth rates. For examples, are growth rates in our region stable over the long term or declining? For Ontario as a whole, there have been more positive than negative growth rates so that overall employment has grown over the last twenty years. For the Northwest, overall employment has declined and a quick visual inspection shows that there are probably more periods of negative employment growth than positive over the last twenty years.
To show trends I've used a simple data smoothing technique called LOWESS which allows for the regression relationship of employment growth rates on year to be demonstrated visually and which can also help take into account extreme observations known as "outliers". The plotted results basically present a long-term trend picture of employment growth rates over time. The individual plots for both the Northwest and Ontario are presented below (Figure 2). The smoothing line essentially is a calculated flexible line of best fit through the data points over time.
Figure 2

The results are also plotted together for comparison purposes (Figure 3) and show results that are both expected and surprising. First, employment growth rates in Ontario have generally been higher than for Northwestern Ontario - the one exception was during the early 1990s when Ontario as a whole actually did slightly worse. Since then, there has been a growth gap and the gap has grown over time. Second, both Ontario and the Northwest have seen declining employment growth rates over the last decade. Employment growth rates in Ontario peaked in 2000 and have since been declining though the long term shows they are still positive. For Northwestern Ontario, the peak was reached in the late 1990s and there has been decline since with average long term trend showing negative growth rates since 2002.
Figure 3

These results are fascinating because they actually show the same trend in both Ontario and the Northwest - declining employment growth rates over the last decade. The difference is that Ontario has a whole still has averaged positive albeit small growth rates whereas the Northwest has headed into negative territory. The northwest has simply been harder hit because of its employment concentration in forestry whereas Ontario as a whole has not been as affected by the manufacturing sector decline because of its greater diversification. This reinforces my view that Ontario over the last decade has been a province facing serious economic challenges. Its per capita real GDP performance has been the worst in the country and this additional evidence showing declining employment growth rates reinforces the economic challenges it faces.
- Sep 26, 2011 Posted By: Livio Di Matteo Tags: city council, construction, humour, thunder bay, traffic
One of the pleasures of living in Thunder Bay is that commuting to work or anywhere else for that matter is usually not very time consuming. Well, over the course of the last week in Thunder Bay, it has taken me almost 25 minutes to drive to places that customarily take only 5 minutes. Last week, a trip to the Port Arthur Health Centre from work took me twenty minutes as Oliver Road was under construction and traffic was backed up along a detour on High Street. Then today, a trip to Intercity saw bumper to bumper traffic along Memorial and Central Avenue as a chunk of Fort William Road was closed due to construction. For a City where five cars lined up to turn left constitutes traffic congestion, it was positively traumatic. It felt like being in Toronto but of course without the dining, shopping and entertainment.
Why all this construction is underway in September rather than during the summer is a question that I ask myself every year but perhaps this is all part of a master plan on the part of our City leaders to give Thunder Bay the big city cosmopolitan urban feel they crave for the promotional brochures. Step One. Encourage new commercial and institutional development on two lane roads (like Junot between Red River and the Harbour Expressway) so as to create congested traffic flow. Step Two. Encourage as much new commercial development as humanly possible away from the downtown cores and into the Intercity Area. Step Three. Wherever it appears that traffic is actually flowing, install a new set of traffic lights and make sure they are not synchronized. Step Four. Strategically time construction for the start of the school year and make sure that at least one of the key north-south routes through intercity is under construction. If it involves a bridge, so much the better. Step Five. Add confusingly marked bike lanes on as many routes as possible.
The result? Funneling ten times more vehicles than usual through a given roadway creates bumper to bumper traffic and the congestion of being in Calgary or Toronto but without the travel cost of a plane fare. As an added bonus, to all of the above can be added the quintessential Thunder Bay traffic experience - watching a freight train merrily wind its way through intercity. It is all part of the immeasurable majesty of Thunder Bay.
Why are gas prices still so high in Thunder Bay? The traffic master plan is ultimately linked to fiscal stimulus for Thunder Bay's ailing gas station sector. What better way to stimulate the economy than create traffic jams that with all that idling in traffic boosts the demand for gas, keeping prices up. Its a classic government job creation strategy.
- Sep 23, 2011 Posted By: Livio Di Matteo Tags: election, leaders debate, mcguinty absence, north, ontario
Today is the NOMA provincial party leaders debate in Thunder Bay between Tim Hudak and Andrea Horwath. Premier McGuinty has declined to attend. The premier apparently has a previous engagement and furthermore probably believes that as the premier for all Ontario, debates should be held with the entire province rather than a single region as the stage. The outrage in the North has been palpable but in simple cost-benefit terms, if I were the premier, I would have made the same decision. I probably also would have added that the debate seemed exclusionary and elitist given that according to my last look it required a 95 dollar conference admission fee. But then what do I know, I'm an economist, not a political advisor. (By the way, the charge of elitism can be deflected by the fact the debate is being webcast on the NOMA site. NOMA stands for Northwestern Ontario Municipal Association. Web Coverage is also available on Netnewsledger.).
For Dalton McGuinty, coming to Northern Ontario for a regional debate is fraught with high costs and little in the way of benefits. This is a region - that usually tends to vote Liberal or NDP anyway. It generally is not an arena for rational and open debate with a reasonable chance that you can change someone's mind, but a highly partisan political herd environment. In some ridings, the tradition is to vote Liberal and when you want to punish the Liberals you vote NDP. Given the anger over what many see as a weak response to the forest sector crisis by the provincial Liberal government, the desire to publicly punish is high. Having Tim Hudak and Andrea Horwath pummel the premier on forestry job losses when they have not had that much to say about forestry policy themselves is probably not how the premier wants to spend his day.
The debate is also being held in a region that is relatively marginal compared to the vote rich GTA. It is difficult to see the premier turning down a similar chance to debate the other two leaders in Toronto on the issue of the GTA as Ontario's economic driver. The media is clustered in Toronto as are the voters. In the case of the Northern debate, not too many people in Toronto will be paying attention to the debate anyway unless he makes a major gaffe that is trumpeted in the evening newscasts.
The result of the political calculus? Coming to the Northern debate has high costs and very low benefits. Given the very small number of seats at stake particularly in the Northwest where the debate will receive the greatest coverage, he is willing to take his chances.
<div class="statcounter"><a title="tumblr visit counter" href="http://statcounter.com/tumblr/" target="_blank"><img class="statcounter" src="http://c.statcounter.com/6528705/0/aa6c5f8c/1/" alt="tumblr visit counter" ></a></div>
Ontario’s economy when examined in terms of its real per capita GDP has not performed exceptionally well over the last decade. Moreover, its real per capita GDP has grown slower than that of most other provinces such that while it was 34 percent above the Canadian average in 1981, by 2009 it was only 10 percent above the average. Growth over the last decade in real per capita output has been much slower than the 1990s even if one excludes the effects of the Great Recession. Over the period 1990 to 2000, real per capita GDP in Ontario grew by 21 percent while between 2000 and 2007 (just before the Great Recession started reducing it) it only grew by 6 percent. So what are Ontario’s major political parties proposing in order to reverse this economic stall and getting Ontario to start growing again and creating jobs and output?
While there are similarities across all three of the main parties given their middle of the road political nature, in terms of economic development philosophies, the Liberals and the NDP are probably the most similar. They both see the role of the provincial government as rather dirigiste when it comes to the economy. The Liberals see economic development as flowing from direct financial incentives provided to stimulate private sector activity whether it is the green energy sector, the automobile sector, or public transit. They have coupled this with plans to continue reducing business taxes. This incidentally is the strategy that has been employed for much of the Liberal regime since 2003. However, given the weak economic growth since 2000, the claim can be made that their policy was side swiped by the Recession.
The NDP wants a buy/made in Ontario policy and will also lower some business taxes - at least for small business. They are less keen on lowering taxes for corporations unless those corporations demonstrate they are creating jobs. They are proposing a tax credit for companies that invest in buildings, machinery and equipment in Ontario. The Conservative plan for jobs and growth focuses on reducing red tape and regulation for small businesses and implementing tax reductions. Absent from the Conservative platform is direct government subsidization or major incentive programs for key industrial sectors.
Is any of this important? It is if we believe government can influence economic growth and that we may be headed for a minority government. A new seat projection by the Laurier Institute for the Study of Public Opinion and Policy indicates that if an election were held today, the Liberals would win 46 of the 107 seats in the provincial legislature while the Tories would take 41 and the NDP would get 20. This would be a Liberal minority and the question is what will economic policy for Ontario be when it comes to jobs and growth?
Would the Liberals seek an alliance or accord with the NDP and implement an HST reduction while slowing down their business tax reduction plans? An alliance with the NDP seems logical as both the Liberals and the NDP have government policy and intervention at the center of their jobs and growth strategy. However, cooperating with the NDP gives their platform additional legitimacy and it is the NDP that has been eroding the Liberal vote the most. Would the Liberals ally with Conservatives? Probably not given the greater philosophical differences. How about the Conservatives and the NDP? Both the Conservatives and the New Democrats pledge to remove the HST from some items such as energy and heating which is essentially a tax reduction but that is probably not enough to hang a formal relationship on given their divergent economic philosophies. If there is a Liberal minority, the odds are thus good they will go it along on a vote by vote basis meaning there will probably be another election very soon thereafter. It also means a period of some political instability which puts the business of getting the economy moving again on hold.
<div class="statcounter"><a title="drupal statistics module" href="http://statcounter.com/drupal/" target="_blank"><img class="statcounter" src="http://c.statcounter.com/6528705/0/aa6c5f8c/1/" alt="drupal statistics module" ></a></div>
- Sep 19, 2011 Posted By: Livio Di Matteo Tags: business, infrastructure, investment, remote communities
Out of the Canadian Chamber of Commerce comes a new report titled ”The Business Case for Investing in Canada’s Remote Communities,” which argues that Canadians need to start looking at remote communities somewhat differently. Despite the perception (and often the reality) that remote communities are dependent on government assistance for their survival, the new reality is that as the demand for resources rises and the international community flocks to Canadian resources in remote areas, these remote communities are wealth generators that will enhance the living standards of all Canadians. Moreover, the aboriginal population is concentrated in these areas and resource development is an important tool to improve their economic welfare.
There are of course challenges. As the report notes:
“There is no doubt that many remote communities-which are often difficult to reach, have challenging geographies, harsh climates, limited infrastructure and sparse populations – face significant challenges to their long-term social and economic sustainability.”
At the same time, the presence of natural resources in these remote regions offers an opportunity for future economic development but investment is required for these communities to take advantage of the resource opportunities. This investment need not necessarily be from government – there can be business investment in remote communities. According to this report, business investment can bring more effective, faster and less costly economic development but to build the case for business investment, these communities must have marketable products as well as a skilled workforce and capital infrastructure. Public policy is critical here in ensuring education, access to health care, transportation and communications links. The challenge in an era of deficit reduction to providing this critical infrastructure can be met according to the report by having government and business build partnerships. For example, federal and provincial infrastructure projects should consider the commercial benefits of location when considering their human capital and infrastructure investments in remote areas. Their spending should be seen as an investment rather than a subsidy particularly if linked to the exploitation of market opportunities by the private sector. The report goes on to make a number of recommendations – first of which is for the federal government to review and improve the funding formula for aboriginal education to ensure parity with the provincial funding model in each province. Education for First Nations is critical given their young demographic profile and their concentration in remote resource areas.
This report is of course advocacy for Canada’s remote communities but it makes an important point. Canada has a vast geography with a wealth of natural resources that are in growing demand but to access and harvest and process those resources, people do need to live in remote areas. It is bad for business to have remote communities without adequate transport or broadband links, poor schools and hazardous drinking water. About 15 percent of Canadians still live in areas considered rural/remote – nearly five million people. Five million is a lot of people to have treated as second-class citizens, particularly given they are indispensable when it comes opportunities on Canada’s resource frontier.
<div class="statcounter"><a title="tumblr counter" href="http://statcounter.com/tumblr/" target="_blank"><img class="statcounter" src="http://c.statcounter.com/6528705/0/aa6c5f8c/1/" alt="tumblr counter" ></a></div>
- Sep 18, 2011 Posted By: Livio Di Matteo Tags: election, ontario, predictions, twitter
It has now been almost two weeks since the Ontario election was called and during that time the number of Twitter followers the four party leaders have has started to grow at a faster rate but the overall rankings have not shifted since I began keeping track on June 30th. Currently, Tim Hudak has 10,671 followers (up from 7,889 on June 30th), Andrea Horwath has 6,930 (up from 4,518), Dalton McGuinty has 15,356 (up from 11,477) and Mike Schreiner has 2034 (up from 1,286).

What has changed a bit is the distribution since the end of the summer. Andrea Horwath has increased her share of Twitter followers from 18 to 20 percent. Essentially, her followers have grown at a faster rate than any of the other three leaders. Since June 30th, Tim Hudak's share has declined from 31 to 30 percent and Dalton McGuinty's share has declined from 45 to 44 percent while Mike Schreiner's share has remained fixed at 6 percent. Much of this distributional change has occurred since the end of August and may be a reflection of the "Orange wave" that so many have remarked about. If the seats in the legislature broke up along the lines of the Twitter distribution, you would have 47 Liberals, 21 NDP and 32 Conservative and 6 Greens - a minority Liberal government. However, based on Twitter counts, the overall picture still seems the same. Moreover, electoral ridings are first past the post meaning it is unlikely any Greens will be elected.This of course is in marked contrast to some of the poll results which have picked up some remarkably varying results.

It is interesting to note that the Ontario Election Prediction Project web site currently has the following prediction of the 107 Ontario seats: Liberals 18, Conservatives 29, New Democrats 15 and 45 too close to call. If the too close to call seats break along the others, you would be looking at a minority Conservative government. In terms of Northwestern Ontario ridings, it predicts Thunder-Bay Atikokan as going NDP, Kenora-Rainy River as going NDP and Thunder Bay-Superior North as too close to call. For the 11 northern Ontario riding as a whole, 5 are currently predicted to go NDP, 2 Conservative, 1 Liberal and 3 are too close to call. There are still almost three weeks to go. Its going to be exciting. My call right now is for a minority provincial government.
- Sep 18, 2011 Posted By: Livio Di Matteo Tags: conservatives, deficit, liberals, ndp, ontario
The small matter of a huge debt
Livio Di Matteo, Ottawa Citizen, September 16, 2011

Ontario Finance Minister Dwight Duncan delivers the budget in March. Whatever party forms the government after Oct. 6, expect larger debt and debt-service costs, says Livio Di Matteo.
Photograph by: Mark Blinch, REUTERS
The most pressing issue for this fall's Ontario provincial election is the precarious state of the province's public finances, with a deficit according to the last provincial budget of $16.7 billion in 2010/11 but now revised to only $14 billion. Needless to say, with these kinds of deficits, the net public debt will soon break the $250-billion mark and generate debt-service costs that will eat into program spending. According to the Public Accounts, we are now spending $9.5 billion a year on servicing the provincial debt.
To fix Ontario's public finances, what must be addressed is the balance between revenues and expenditures. Over the period 2001-2011, total expenditures grew at an average annual rate of 6.2 per cent and revenues at an average annual rate of 4.7 per cent - an unsustainable trend. Starting from expenditures of $120.7 billion and revenues of $106.7 billion and projecting forward at these growth rates, by 2015/16 expenditures would be about $154 billion dollars and revenues $128 billion - a deficit of $26 billion. Clearly, the expenditure growth rate needs to fall or the revenue growth rate needs to rise or some combination thereof.
What might the deficit look like depending on the election outcome? Based on information in their platform cost document, medium-term revenues and expenditures projections under the Liberal plan amount to average annual revenue growth of about 4.5 per cent and average annual total expenditure growth of about 2.3 per cent. The gap between revenue and expenditure growth rates is substantial at 2.2 per cent. The provincial Liberal plan is to eliminate the deficit by 2017/18 and their projections do lower the growth rate of expenditures such that the budget would balance by then. However, by the time it balances, about another $70 billion will be added to the province's debt and that assumes there is not another recession.
As for the Progressive Conservatives, they have proposed cutting Ontario government spending by about two per cent a year on programs outside of health and education until the budget is balanced by about 2017/18. This will also be accompanied by some new spending and some tax relief. When one looks at the revenue and expenditure projections provided in the Changebook backgrounder, expenditures will rise at an annual average rate of 1.7 per cent while revenues are expected to rise at a rate of 4.2 per cent - a gap of 2.5 per cent. This plan, if successfully implemented, would also eliminate the deficit by 2017, but will add about another $60 billion to the debt by then.
The New Democrats do not yet provide a detailed forecast of how their plan will affect future provincial revenues and expenditures and ultimately the deficit. Their main plank is fiscally faith-based with a graph showing that since 1980/81, when one looks at the percentage of deficits incurred by all Canadian federal and provincial governments, New Democratic governments have run the fewest. They do however provide a tally of their savings and revenues and their expenditure priorities, which, using the 2010/11 revenue and expenditure figures as a base, amounts to an additional average annual increase of two per cent to revenues and a 1.4-per-cent increase to expenditures. Thus, they do plan to add to their revenues faster than their expenditures, but if the gap is indeed only 0.6 per cent it will take a very long time for the deficit to disappear. The New Democrats must provide more information on how they would deal with the deficit.
These plans of course are at best forecasts and subject to changing economic conditions and political circumstance. The best long-term debt and deficit fighter is of course robust economic growth and Ontario's economy is facing chronic productivity and growth challenges. However, at this point, if one is to take these plans at their word, one can make the following conclusions.
First, the Liberal and Conservative plans would both eliminate the deficit by about 2017 but under the Liberals, revenues and expenditures as well as the debt would all be higher. In some sense, they have put forth a higher-cost plan to eliminate the deficit. However, given evolving circumstances over the span of time, the differences between the two plans may not turn out to be that much different.
Second, the New Democrats have really yet to put forth a credible plan on how to deal with the public finances, but the indications to date suggest they are prepared to take an even longer time horizon to deal with the deficit.
Third, whatever party forms the government after Oct. 6, be prepared for a much larger debt and debt-service costs.
Livio Di Matteo is professor of economics at Lakehead University and a contributor to Worthwhile Canadian Initiative, Canada's premier economics blog (worthwhile.typepad.com).
- Sep 16, 2011 Posted By: Livio Di Matteo Tags: bob rae, dalton mcguinty, fiscal policy, fp comment, mike harris, ontario, taxation, tim hudak
In Ontario, everyone’s a taxman
Sep 14, 2011 – Special to the Financial Post

Ontario’s political culture has hiked taxation, whatever party is in power
By Livio Di Matteo
Is Ontario Premier Dalton McGuinty “The Taxman,” as Progressive Conservative leader Tim Hudak has been claiming in his bid to become the next premier of Ontario? Hudak has pointed to Ontario’s Health Care Premium and the eco-fee fiasco, as well as the HST. This begs the following question: Has the McGuinty government raised Ontario’s tax burden? Is he “The Taxman”?
As always, public finance issues, especially with respect to taxation, are complex. But data from the federal Fiscal Reference Tables can be used to shed some light on this question.
However, rather than taxes, the term “own-source revenue” is probably a better descriptor because the Ontario provincial government raises revenue not just from income and sales taxes, but also from assorted fees, gambling revenues, liquor sales and natural resource rents. These, in essence, all represent a transfer from the private to the public sector and thus constitute “taxation.” In addition, one needs to look at these revenues not in absolute values but in inflation-adjusted dollars per capita, as well as a share of the province’s output.
Real per-capita own-source Ontario provincial government revenue (in 1997 dollars) rose from $3,261 per person in 1986-87 to $4,116 by 2009-10. It is, of course, subject to ebbs and flows as a result of business-cycle fluctuations and has dropped substantially over the last couple of years, due to the recession. However, it peaked in 2007-08, during Premier McGuinty’s tenure, at $5,052.
Yet, one also needs to be aware that it has trended upward over a time span that includes the governments of David Peterson, Bob Rae, Mike Harris and Ernie Eves, as well as Dalton McGuinty. All of these premiers saw years with some substantial increases in real per-capita own-source revenues, as well as years with declines. These declines were mainly due to economic slowdowns rather than explicit tax relief, especially during the Rae era. Meanwhile, the increases in own-source revenue, particularly in the Harris years, were also a function of the expanding tax base due to a booming economy.
The ratio of own-source revenue to GDP represents the burden of revenue raising on the economy as a whole and probably better reflects business-cycle fluctuations, as both GDP and government revenues move in conjunction with the business cycle. Here, the trend is also upward over time. Whereas in 1986-87 provincial own-source revenues accounted for 10.5% of the province’s GDP, by 2009-10 it had climbed to 12.7%. This ratio also peaks just before the recession in 2007-08, during Premier McGuinty’s tenure, at 14.8%. During the recent recession, Ontario government own-source revenues have actually plummeted even faster than GDP.
On the face of it, the McGuinty government is associated with some of the highest values of both real per-capita own-source government revenues and the share of GDP accounted for by those revenues. Does that make Mr. McGuinty the taxman? It does for the time being, but history suggests the title can be a fleeting one. Average annual real per-capita own-source revenues were $3,605 under David Peterson, $3,535 under Bob Rae, $4,398 under Mike Harris/Ernie Eves and $4,663 under Dalton McGuinty.
The average value of the own-source revenue to GDP ratio was 11.7% under David Peterson, 12.1% under Bob Rae, 12.9% during the Harris-Eves era and 13.6% during the McGuinty era. The trend toward greater taxation and revenue appropriation by Ontario’s government is not a recent phenomenon but an upward trend over the last 20 years, no matter who has been in power.
Dalton McGuinty has indeed presided over an era where the provincial own-source revenue to GDP ratio has reached its greatest height, but he has been able to do so by building on the work of his predecessors. Ontario’s politicians have all been part of a provincial political culture that has expanded the role of government and supported it with ever-greater tax revenues. They have all been “taxmen.”
Financial Post
Livio Di Matteo is professor of economics at Lakehead University.
Livio Di Matteo is professor of economics at Lakehead University.
- Sep 14, 2011 Posted By: Livio Di Matteo Tags: ccpa, jim stanford, ontario, real per capita gdp, tim hudak's geometry
Jim Stanford has just published a commentary on the Ontario Conservative Party's Changebook in which he criticizes the graphs and statistics used. In his Graphs for Dummies: The Troubled Geometry of Tim Hudak’s changebook he argues that there is a misleading pattern of visual presentation in those graphs. One criticized graph in particular caught my attention – the one on the change in real per capita GDP for Canada’s provinces between 2000 and 2010 – because it was my graph. I only realized something might be up when I got a call from a Radio-Canada reporter asking about the graph prompting me to do a web search. According to the news release on Canada Newswire issued by the Canadian Centre for Policy Alternatives:
“One graph presents statistical claims that are calculated from outdated forecasts (rather than actual data), without indicating this to readers; when actual (rather than forecast) data is used, the graph's conclusion is reversed completely.”
Reading the actual report, the account is a bit more nuanced and the criticisms are more directed at the Conservative Party’s use of the graph than my work personally (he did not accuse me of drawing cartoons) but nonetheless I think it is important to direct some points back to Mr. Stanford.
I should provide some background. I was invited to present at pre-budget submission hearings at Queen’s Park last January (by Norm Miller, a Conservative MPP) and presented on January 31st. I put together some power point slides on Ontario’s economy and fiscal situation using data from Statistics Canada and the Ontario government (acknowledged on the third slide) to support my talk. The slides are available on my Economics Department web page.
The slide showing that Ontario fared the worst among the ten provinces in real per capita GDP growth between 2000 and 2010 eventually found its way into Tim Hudak’s Changebook. I suppose it would have been nice to have been given notice my work was being used in a political document but on the other hand my presentation was a public document and no one asks me when they cite my other publications. By the same token, it would also have been courteous for Mr. Stanford to send me a copy of his critique once released given the kind provision of my time to him answering his questions rather than having to hear it second hand via the media. It would appear that a lack of common courtesy crosses political affiliations.
Contrary to Mr. Stanford’s statement, there was no “report” but only a set of slides used to support a verbal presentation. The GDP, population and price index numbers (with 1997 as the base year) I used for the specific graph mentioned were from a specific data set maintained by the Canadian Institute for Health Information which obtains its price and GDP numbers from Statistics Canada. The GDP numbers for 2009 and 2010 were forecasts but then everyone who uses provincial GDP numbers knows that given lags the end points are forecasts subject to revisions. Contrary to what the CCPA press release would have you believe, they are “actual data” and at the time used they were not “outdated” forecasts. Indeed, everyone who uses provincial GDP numbers knows that the provincial GDP numbers are subject to frequent revision and even the numbers that Mr. Stanford uses in his revised calculations will probably be revised several years down the road. Should he eventually be accused of not using actual data? Mr. Stanford also argues the price deflator used was inappropriate because it was not chained $2002 dollars. It was still a legitimate price deflator and so what if the base year was 1997?
Mr. Stanford then calculates his own numbers using the revised data but uses the period 1999 to 2009 and lo and behold, Ontario now sees positive real per capita GDP growth of 4.4 percent over a 10-year period – still the lowest in the country and practically flat when spread over 10 years. This was of course the point of my presentation, that Ontario faced serious productivity and economic problems and had fared the worst in terms of per capita income performance during the stagnant first decade of the 21st century. So we now have different numbers, but the same relative performance. In addition, Mr. Stanford mentions that he has recalculated the series using actual 10-year trends but offers no details on how exactly how those trends were estimated.
So I’ve also gone off and collected revised Statistics Canada real GDP numbers in 2002 constant prices for the period 1990 to 2009 and drawn my own revised graph for the 2000 to 2009 period (See Figure below). I’ve included the data series from Statistics Canada that were used at the bottom of this post in case Mr. Stanford wishes to cite them all on his next power point presentation. The results are now different particularly for New Brunswick, Newfoundland and Alberta. Newfoundland and Alberta now see much lower growth rates than before while New Bunswick is now much higher. That is the result of the revisions. A serious policy issue is what can be done to address these types of fluctuations in official data sources?
What about Ontario? Well, rather than eight percent negative growth it is now only minus two percent and still the worst performance in the country. Ontario’s performance is indeed removed from that of the rest of the country – it is poor. Its negative whether you calculate it from 2000 to 2009, 2001 to 2009, 2002 to 2009 or 2003 to 2009 ranging from -1.4 to -2.9 percent. (I get 2.7 rather than 4.4 when I do it from 1999 to 2009). So why exactly should these results be characterized as a dishonest presentation? However, I can only speak for my own work and the graph that I did. How flawed and over the top is Mr. Stanford’s analysis of all the other graphs? By the way Mr. Stanford, a minor point but my last name should be spelled “Di Matteo” rather than "di Matteo".

Data Source:
GDP
v41975039 Newfoundland and Labrador; 2002 constant prices; Gross domestic product (GDP)
|
||||
v41975081 Prince Edward Island; 2002 constant prices; Gross domestic product (GDP)
|
||||
v41975123 Nova Scotia; 2002 constant prices; Gross domestic product (GDP)
|
||||
v41975165 New Brunswick; 2002 constant prices; Gross domestic product (GDP)
|
||||
v41975207 Quebec; 2002 constant prices; Gross domestic product (GDP)
|
||||
v41975249 Ontario; 2002 constant prices; Gross domestic product (GDP)
|
||||
v41975291 Manitoba; 2002 constant prices; Gross domestic product (GDP)
|
||||
v41975333 Saskatchewan; 2002 constant prices; Gross domestic product (GDP)
|
||||
v41975375 Alberta; 2002 constant prices; Gross domestic product (GDP)
|
||||
v41975417 British Columbia; 2002 constant prices; Gross domestic product (GDP)
|
||||
Population Series
|
||||
v466983 Newfoundland and Labrador; Both sexes; All ages (Persons)
|
||||
v467298 Prince Edward Island; Both sexes; All ages (Persons)
|
||||
v467613 Nova Scotia; Both sexes; All ages (Persons)
|
||||
v467928 New Brunswick; Both sexes; All ages (Persons)
|
||||
v468243 Quebec; Both sexes; All ages (Persons)
|
||||
v468558 Ontario; Both sexes; All ages (Persons)
|
||||
v468873 Manitoba; Both sexes; All ages (Persons)
|
||||
v469188 Saskatchewan; Both sexes; All ages (Persons)
|
||||
v469503 Alberta; Both sexes; All ages (Persons)
|
||||
v469818 British Columbia; Both sexes; All ages (Persons)
|
||||
- Sep 13, 2011 Posted By: Livio Di Matteo Tags: canada, economy, employment, gdp, manitoba, provinces, ranking
Manitoba in the muddled middle
Winnipeg Free Press, September 10, 2011, Winnipeg, Manitoba
by Livio Di Matteo
Autumn traditionally sees birds fly south, but this year voters will also be flocking to the polls in five of Canada's provinces. October will see provincial elections in Manitoba, Ontario, Prince Edward Island, and Newfoundland and Labrador. Then come November, Saskatchewan will follow.
While each province has its own unique political culture and issues, one common denominator will be the state of the economy and how their province has done compared with other provinces. Here are some simple indicators for the first decade of the 21st century.
First, consider average monthly employment growth. Over the period from 2000 to 2010, despite the recession, all provinces saw an expansion in employment.
A comparative ranking puts Alberta at the top of the heap with overall employment growth of 27 per cent -- even with the effects of the recession. British Columbia and Quebec were next at 17 per cent and 15 per cent respectively followed by hard-pressed Ontario, which nevertheless saw its employment grow by 14 per cent.
Manitoba ranked sixth at 12 per cent employment growth -- just behind P.E.I. -- followed by Newfoundland, Nova Scotia and finally New Brunswick, which saw its employment level only grow by an anemic seven per cent.
Next, consider the growth in real GDP. Here the results put the three resource-producing provinces on top -- Newfoundland and Labrador saw its real output grow an amazing 40 per cent, followed by 27 per cent growth in Alberta and 21 per cent growth in Saskatchewan. British Columbia and Quebec are next followed by Manitoba in at sixth place with a 10 per cent increase in real GDP. Then come P.E.I., Nova Scotia and Ontario. Ontario comes in second last at only four per cent -- but ahead of New Brunswick, which saw its real GDP shrink by about four per cent.
If one sums the growth rate in employment and the growth rate of real GDP and ranks the provinces from highest to lowest and then sets the highest-ranking province at a score of 100, then one gets a neat little comparative index of provincial growth prosperity over the course of the early 21st century. Alberta ranks first at a score of 100 followed by Newfoundland and Labrador at 92 and then a long drop to British Columbia in third place with a score of 60.

Saskatchewan and Quebec are close behind with scores of 58 and 50 respectively and then Manitoba -- again in sixth place -- with a score of 40. Prince Edward Island follows with 38, Ontario is next tied with Nova Scotia at 32 and finally New Brunswick ends it off with a score of seven.
Saskatchewan and British Columbia are in the top half of the prosperity index and that should bode well for their governing parties though the HST issue dogging British Columbia means any talk of an early fall 2011 election has ended.
Newfoundland and Labrador does well in this prosperity index but its high rank results mainly from GDP rather than employment growth. This may be an issue if the electorate feels the benefits of growth and prosperity have not translated into enough jobs.
As for Prince Edward Island, it will be able to boast it is doing better than Nova Scotia and New Brunswick as well as Ontario.
As for Ontario, its performance over the course of the decade has generally been dismal putting it in the same league as New Brunswick and Nova Scotia.
It is no coincidence the same decade also saw Ontario start receiving equalization payments. Ontario is afflicted by productivity problems as it managed to increase employment faster than real GDP. Ontario voters are used to seeing themselves as the economic engine of Confederation and their diminished status will leave them looking for policies that promise to restore their imperial grandeur.
Manitobans will be in a bit of a dilemma when it comes to making their political choices. Manitoba is almost in the middle of these rankings -- the proverbial Goldilocks province with an economy that seems never too hot nor too cold.
Manitobans can look west and lament they lag Saskatchewan and Alberta or they can look east and thank their lucky stars they are not Ontario or New Brunswick. Manitobans can rationalize their performance with respect to their western neighbours by noting there is no oil or potash driving their economy.
As for their eastern neighbours, they should not get too smug. Over the period 2000 to 2010, Manitoba's real GDP did not manage to grow that much faster than either P.E.I. or Nova Scotia. Like Ontario, Manitoba also faces some economic productivity issues.
Livio Di Matteo is professor of economics at Lakehead University. He is also a contributor to the economics blog Worthwhile Canadian Initiative.
- Sep 13, 2011 Posted By: Livio Di Matteo Tags: none
One word - recession. The Canadian economy may be teetering on the edge of recession and a number of reports today paint an ominous picture. First, there was the report by Bank of Nova Scotia economists that Canada may be the first to stumble into recession this year. Second, there was the national balance sheet report by Statistics Canada which shows that per capita household net worth has declined. A recession brought on by declining business investment and falling exports coupled with the wealth effects of declining net worth are enough to keep the bravest central banker or finance minister up at night. Wealth effects from a collapsing real estate and stock market are what have contributed to the severity of the U.S. recession and stagnant recovery since 2008. Read about it in my latest posting at Worthwhile Canadian Initiative.
<div class="statcounter"><a title="tumblr tracker" href="http://statcounter.com/tumblr/" target="_blank"><img class="statcounter" src="http://c.statcounter.com/6528705/0/aa6c5f8c/1/" alt="tumblr tracker" ></a></div>
- Sep 12, 2011 Posted By: Livio Di Matteo Tags: conservative, deficit, expenditure, forecast, liberal, ontario, revenues
Ontario's provincial parties have released their platforms and budget costing and fiscal forecasting is part of the package at least for the Conservatives and the Liberals. The NDP do not yet have a detailed projection of what they might anticipate revenues and expenditures to be like if they form the government though I'm not sure they will be providing one given their platform stresses that their fiscal competence should be measured by the fact that across Canada, New Democratic governments have been the least likely to run deficits. It is an odd argument, requiring one to accept that they will be fiscally responsible on faith alone.

As for the Liberal and Conservative plans, the accompanying figures are from the Liberal Platform costing document and the Changebook Backgrounder and they show remarkably similar trajectories for revenues and expenditures that will balance the Ontario budget by 2017. A difference is that Liberal revenues and expenditures are generally both a bit higher than the Conservative projections. This could be due to the so-called "hole" that the Liberals have referred the Conservatives as having in their projections but it could also be the result of a more optimistic view of future revenues and spending on the part of the governing Liberals. In the end, they both seem to get to the same place but the Liberals spend and tax a bit more to get there. Its not really a big difference and both forecasts will be quite sensitive to what happens to economic growth over the next decade. Another severe recession should be enough to put both sets of forecasts out of kilter.

- Sep 9, 2011 Posted By: Livio Di Matteo Tags: devolution, economy, issues, northern ontario, ontario, provincial election
As the provincial election campaign begins, undoubtedly the need to articulate northern issues will be an important one. The conventional wisdom would probably argue that the most important issues are jobs and the economy, followed by health care. A glance at the “northern platforms” of the three parties certainly would suggest that the economy is an important focus and there are indeed some similarities across the three main parties when it comes to the economy.
The New Democratic Party argues the North has been ignored by the provincial government and is pledging “respect for the North. ” Its northern policy wants to hire more doctors for under-serviced communities, remove the HST from home heating and electric bills, cap gas prices, create a Northern Ontario legislative committee to address Northern issues and change laws so mining companies must process their raw materials in the province (incidentally, something similar was done a long time ago in Ontario for logs harvested on Crown lands under the rubric of the Manufacturing Condition). The NDP is also promising to repeal the Far North Act. Aspects of the NDP platform are quite similar to what the Conservatives are proposing with respect to the removal of the HST and the repeal of the Far North Act. However, one suspects the Conservative pledge to scrap the Far North Act is probably more robust than the New Democrat’s. As well, both the Conservatives and the NDP have proposed various resource revenue retention schemes for the region, which are attractive given the anticipated mining development in the Ring of Fire.
As for the Liberals, their northern Ontario election platform is really summarized by the Northern Growth Plan which to date has promised a Northern Policy Institute (which has yet to appear but there are still weeks to go in the election campaign which may generate another promise) as well as endless future consultations and planning sessions. No doubt, the legislative committee to address northern issues proposed by the NDP will find itself quite at home with this aspect of the Growth Plan. The more practical aspects of the Liberal northern policy involves announcements of government dollars for construction, roads and health care facilities and millions of dollars have been dispensed in the run up to the election. When it comes to short-term cash dispensation, the Liberals are certainly not “ignoring” the North. In a sense, the Liberals have also not ignored the North when it comes to energy legislation or the Far North Act or the reform of the mining act or forest tenure.
None of these election platform items seems particularly innovative. Indeed, the most innovative set of Northern policies ever proposed in my living memory was the Peterson government of the 1980s which set forth three planks: the Northern Ontario Heritage Fund, Northern Health Travel Grants and a program of decentralization of provincial government offices to the north. Since then, there has really not been articulated any similar set of innovative strategic and concrete initiatives for the North. And despite endless consultations, some of the more important strategic decisions made affecting the North’s long-term development have actually been done without much consultation and in the face of substantial opposition - such as the Far North Act.
All three parties have conveniently side stepped the fundamental policy question when it comes to Northern Ontario. How much responsibility should the North have when it comes to decision making in the region. This is more than a simplistic “who owns the North” or “should the North separate from Ontario” type of question. The north is part of Ontario and Ontario is owned by all of its citizens. However, it is a legitimate question to ask whether more responsibility for decision-making should be devolved to the north especially when it comes to regional economic development, energy and the land base.
The Liberals have already given their answer given their treatment of the north in the Far North Act. The Liberals believe the North should be consulted if necessary but not necessarily consulted with the ultimate decision-making power resting with Queen’s Park. Would the NDP or the Conservatives actually be any different? Would they devolve any significant decision-making powers in the economic sphere to regional northern governments or First Nations? Based on what has been revealed in the NDP platform regarding creating a “northern legislative committee” and the Conservative platform that essentially promises “a strong voice” there is nothing yet to differentiate these two parties from the Liberals when it comes to actual respect for the north.
- Sep 8, 2011 Posted By: Livio Di Matteo Tags: economy, election, employment, northern ontario, ontario
According to a recent Nanos poll conducted for the Globe and Mail, after health care, the economy/jobs is the top concern of Ontario voters. Ontario voters may be interested on how employment growth has fared in their particular neck of the woods under various political regimes. I’ve calculated from Statistics Canada data the average annual growth rate in employment for Ontario as a whole and for each Ontario economic region for three time periods: the NDP regime for the period 1990 to 1995, the Conservative era from 1995 to 2003 and the Liberal epoch from 2003 to 2011. I've included a graph with all of Ontario and its regions as well as one highlighting the North.
Of course these figures do not take into account the length of term, the state of the business cycle (for example the NDP period from 1990 to 1995 was the shortest of the three periods and more dominated by recession) or control for particular regional conditions. Yet, they do provide an average indicator of economic performance via employment growth.
For Ontario as a whole average employment growth was greatest during the period of Conservative rule from 1995 to 2003, which of course also coincided with a long and spectacular economic boom. It was, not surprisingly, lowest during the recessionary period from 1990 to 1995 – a period of NDP governance. As for the Liberal period, it saw employment growth greater than the NDP but lower than the Conservatives. This period caught the tail end of the boom era as well as the Great Recession.
What is more interesting is the regional variation. During the NDP era, though Ontario as a whole saw negative employment growth, some regions weathered the recession reasonably well – namely, Muskoka-Kawarthas, Kitchener-Waterloo-Barrie, London and Northwestern Ontario. However, vote-rich regions like Ottawa, the GTA, Hamilton Niagara and Windsor-Sarnia saw negative growth, which upon reflection may have been yet another factor in the defeat of the Rae government.
During the Conservative era, a rising tide lifted all boats in terms of employment growth rates but growth was the greatest in the GTA, Kitchener-Waterloo-Barrie, Hamilton-Niagara, Ottawa and the Muskokas. As for the Liberal period, growth is again the greatest in these regions but there was also negative employment growth in Windsor-Sarnia and the Northwest.

For the most part, whatever the regime, the Muskoka region, the GTA and Kitchener-Waterloo-Barrie has tended to do better than the provincial average when it comes to employment growth. All the other regions have generally performed more poorly. This may be more a reflection of the concentration of economic activity in central Ontario than any specific comment on the effect of political party in power on the economy. I suppose it would be even more interesting to see how these regions actually voted but it may not be as important as you think. For example, Northwestern Ontario did not elect Conservatives during the 1995-2003 period and elected mainly Liberals for the 2003 to 2011 period and yet performed much worse during the latter period. I suppose political representation is ultimately no protection from exogenous economic shocks.
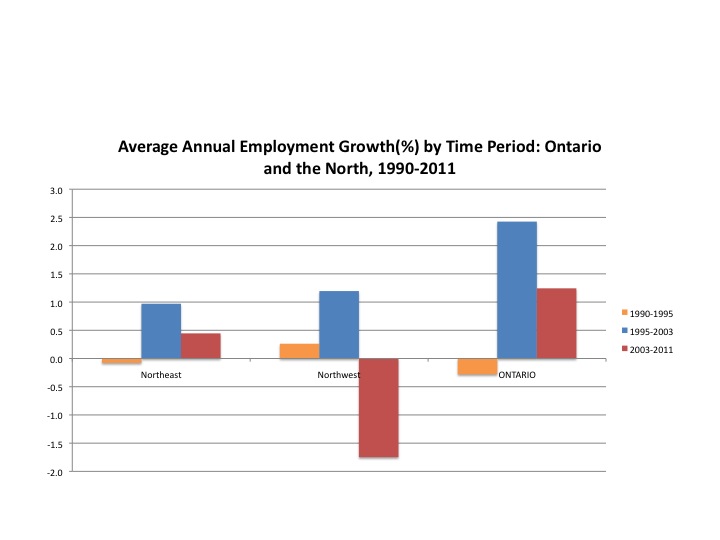
The results for the North are interesting. Under the NDP and Conservative eras, the Northwest did better than the Northeast when it came to employment growth. During the Liberal government period, the Northwest has done very poorly while the Northeast has still seen employment increases on average. Compared to Ontario as a whole, in terms of employment growth, the North did more poorly than Ontario as a whole during the Conservative and Liberal regimes - it did marginally better than Ontario as a whole under the NDP regime. However, its average employment performance was best during the Conservative era. Yet, voting patterns in the North do not reflect this performance difference. Again, it would appear that in politics, the voter equation is more complicated than simple economics.
- Sep 5, 2011 Posted By: Livio Di Matteo Tags: calgary, carpenters, economy, thunder bay, wages
A suitable posting for Labour Day for an economist should inevitably revolve around an analysis of wages. Wages tend to go up during good economic times and their ascent should flatten out during poor economic times and sometimes even decline. This should especially be the case for labour employed in the construction which is a barometer of current investment activity. Even with unionization, wages in construction do have a sensitivity to the economic climate.
As a comparison, take a look at the basic construction union rate (dollars per hour, monthly) for carpenters in Calgary and Thunder Bay during the 40 year period 1971 to 2011 as collected and provided by Statistics Canada. In January 1971, carpenters in Thunder Bay earned $5.35 an hour compared to $4.70 in Calgary. Carpenters in Thunder Bay were earning about 14% more than their Calgary counterparts. As the accompanying figure shows, Thunder Bay carpenters earned more than their Calgary counterparts for almost the next thirty years with the gap actually widening during the late 1980s as the western oil economy went bust. In January 1990, a carpenter in Thunder Bay was earning $22.98 while in Calgary it was $18.50 - a 24 percent difference.
However, during the 1990s, the western economy began to boom again whereas Thunder Bay's economy went into decline - a decline that accelerated during the forest sector crisis. With unionization, wage rates in Thunder Bay did not fall but they rose at a much lower rate after the early 1990s. Meanwhile, wages for carpenters in Calgary began to rise at a faster rate and by 2001 had reached the Thunder Bay level and then proceeded to surpass it. As of January 2011, the basic hourly wage rate for carpenters in Thunder Bay was $32.89 while for Calgary it was $38.63. Calgary's basic carpenter wages are now about 18 percent higher than in Thunder Bay. Wages for carpenters in Calgary appear to have particularly spiked upwards since 2008 - despite the Great Recession it would seem. All in all, a fascinating long-term view of the impact of the ebbs and flows of economic activity.

- Sep 2, 2011 Posted By: Livio Di Matteo Tags: births, increases, northwestern ontario, population
The 20th century fertility decline that affected most western countries was also a Canadian phenomenon and even in northwestern Ontario, annual births and birth rates have fallen. Statistics Canada data on the total number of births annually show that the total number of births in Northwestern Ontario (Districts of Thunder Bay, Rainy River and Kenora) fell from 3,311 in 1996 to a low of 2,540 by 2004 - a 23 percent decline. However, since 2004 there has actually been a recovery in the number of births and they have risen from 2,540 to 2,658 - an increase of about 5 percent. While these figures provide no such insight, the aboriginal population is a factor in the recent increases. The accompanying figures show the annual number of births both for the region as a whole and then separately by district.
Over the period 1996 to 2004, the biggest drops were in Thunder Bay District and Rainy River at about 27 percent each. Kenora District only dropped by about 15 percent. Since 2004, Kenora District has also seen the biggest recovery with an increase of 9 percent followed by Thunder Bay District at just over 3 percent. Rainy River District, however, has continued to decline and the number of births shrank by almost 7 percent since 2004. Of the three districts, Kenora is the most fertile as in 2009 there were 1067 births for a population of 64,419 whereas in Thunder Bay District there were 1,379 births but for a much larger population of 149,063. In per capita terms, Kenora District has the much higher birth rate. The rise in the number of births bodes well for future population growth at least in the medium term particularly in the Kenora District.


- Sep 2, 2011 Posted By: Livio Di Matteo Tags: ontario election, twitter followers
Well, the formal Ontario provincial election campaign begins next week and on the eve of the election its time for an overview of how the four political party leaders fared over the course of the summer. I began tracking the number of Twitter followers for the four leaders on June 30th in an effort to see if their ultimate electoral performance can be predicted by their social media presence.
Dalton McGuinty is still in the lead with just over 14,000 followers for an increase of 23 percent since June 30th. Next is Tim Hudak with just over 9500 followers for an increase of 21 percent since June 30th. Next is Andrea Horwath with 5900 followers but with the greatest percentage increase since June 30th at 32 percent. Finally, Mike Schreiner has about 1700 followers for an increase of 23 percent.
As of September 2nd, I would have to say that while all four leaders have seen growth in the number of followers, the overall distribution has been relatively stable. There has been a small decline in Mike Schreiner's share of twitter followers and a small increase in Andrea Horwath's but the other two party leaders have stayed the same. The election campaign has yet to heat up. The Twitter evidence to date shows the NDP party leader showing the greatest growth but given the low base of support it has not yet translated into a much larger share of total twitter followers. Stay tuned for an update on the Twitter scores in mid-September (or sooner if something dramatic happens).


Well, we are just a few days from the official start of the Ontario provincial election campaign but the simmering summer pot of campaigning is starting to bubble over. The last few days have seen Progressive Conservative Leader Tim Hudak refer to Dalton McGuinty as "The Taxman" on a number of occasions. Has the McGuinty government raised the tax burden on Ontario? I've decided to use data from the Federal Fiscal Reference Tables to shed some light on this.
Well, rather than taxes, the term "own-source revenue" is probably a better description because the provincial government raises revenue not just from income and sales taxes but also from assorted fees, gambling revenues, liquor sales and natural resource rents. These all represent a transfer from the private to the public sector.
I have down below two graphs. On the left is real per capita own source provincial government revenue (in 1997 dollars) from the mid-1980s to the present. This has risen from 3,261 dollars per person in Ontario in 1986/87 to 4,116 dollars in 2009/10. It is of course subject to ebbs and flows as a result of business cycle fluctuations and has dropped substantially over the last couple of years due to the recession. However, it peaked in 2007-08 at 5,052 dollars. Overall, it has trended upward over a time span that includes the governments of David Peterson, Bob Rae, Mike Harris, Ernie Eves and Dalton McGuinty. All of these premiers saw years with substantial increases in per capita own source revenues but also some years with declines.
A better measure is on the right - the ratio of own source revenue to GDP. In a sense it represents the burden of revenue raising on the economy as a whole and probably better reflects business cycle fluctuations as both GDP and revenues move in conjunction with the business cycle. Here, the trend is also upward over time. Whereas the ratio is 0.105 (10.5 percent of GDP)in 1986/87, by 2009/10 it has climbed to 0.127 (12.7 percent). This ratio also peaks in 2007-08 at 14.8 percent. What is interesting is that the average value of this ratio was 11.7 percent under David Peterson, 12.1 percent under Bob Rae, 12.9 percent during the Harris-Eves era and 13.6 percent during the McGuinty era. The trend has been upward over the last twenty years no matter who has been in power. Dalton McGuinty has indeed presided over an era where the provincial own source revenue to GDP ratio has reached its greatest highest but he has been able to do so by standing on the shoulders of his predecessors. They have all been taxmen.
